6-Month Investment Banking & Equity Research Job Guarantee Program
- 100% Job Guarantee
- 6 Months Program
Real-World Finance Skills Training


NewAdmissions Now Open
Get trained by industry experts and land your job in Investment Banking, Equity Research
or Financial Modeling

Trusted by43,465+Students


Designed to meet market demands and propel your career success
 ≈ New Launch ≈
India's First A.I. Focused Finance Program For Commerce
Graduates That Gets You Future Ready


An indicative pathway showing how graduates progress across finance sectors — from entry-level roles to senior leadership over 10–15 years.
Banks & NBFCs — CTC Progression (LPA)

Suhashi
Wealth Management, Anand Rathi
"Finsckool gave me the exact skills I needed to start my career in Wealth Management"
CTC: 11.11 LPA

Yash Agarwal
Equity Research Analyst, Tata AIG
"Finsckool’s live projects and financial modeling training prepared me for real industry challenges. The interview preparation support played a key role in securing my placement."
CTC: 8 LPA

Divyesh
Equity Research Analyst
"Finsckool’s live projects and financial modeling training prepared me for real industry challenges. The interview preparation support played a key role in securing my placement."
CTC: Revealing Soon
A practical 2-day live workshop where you learn how modern finance professionals use AI to build reports, analyze companies, and prepare for high-growth finance roles.

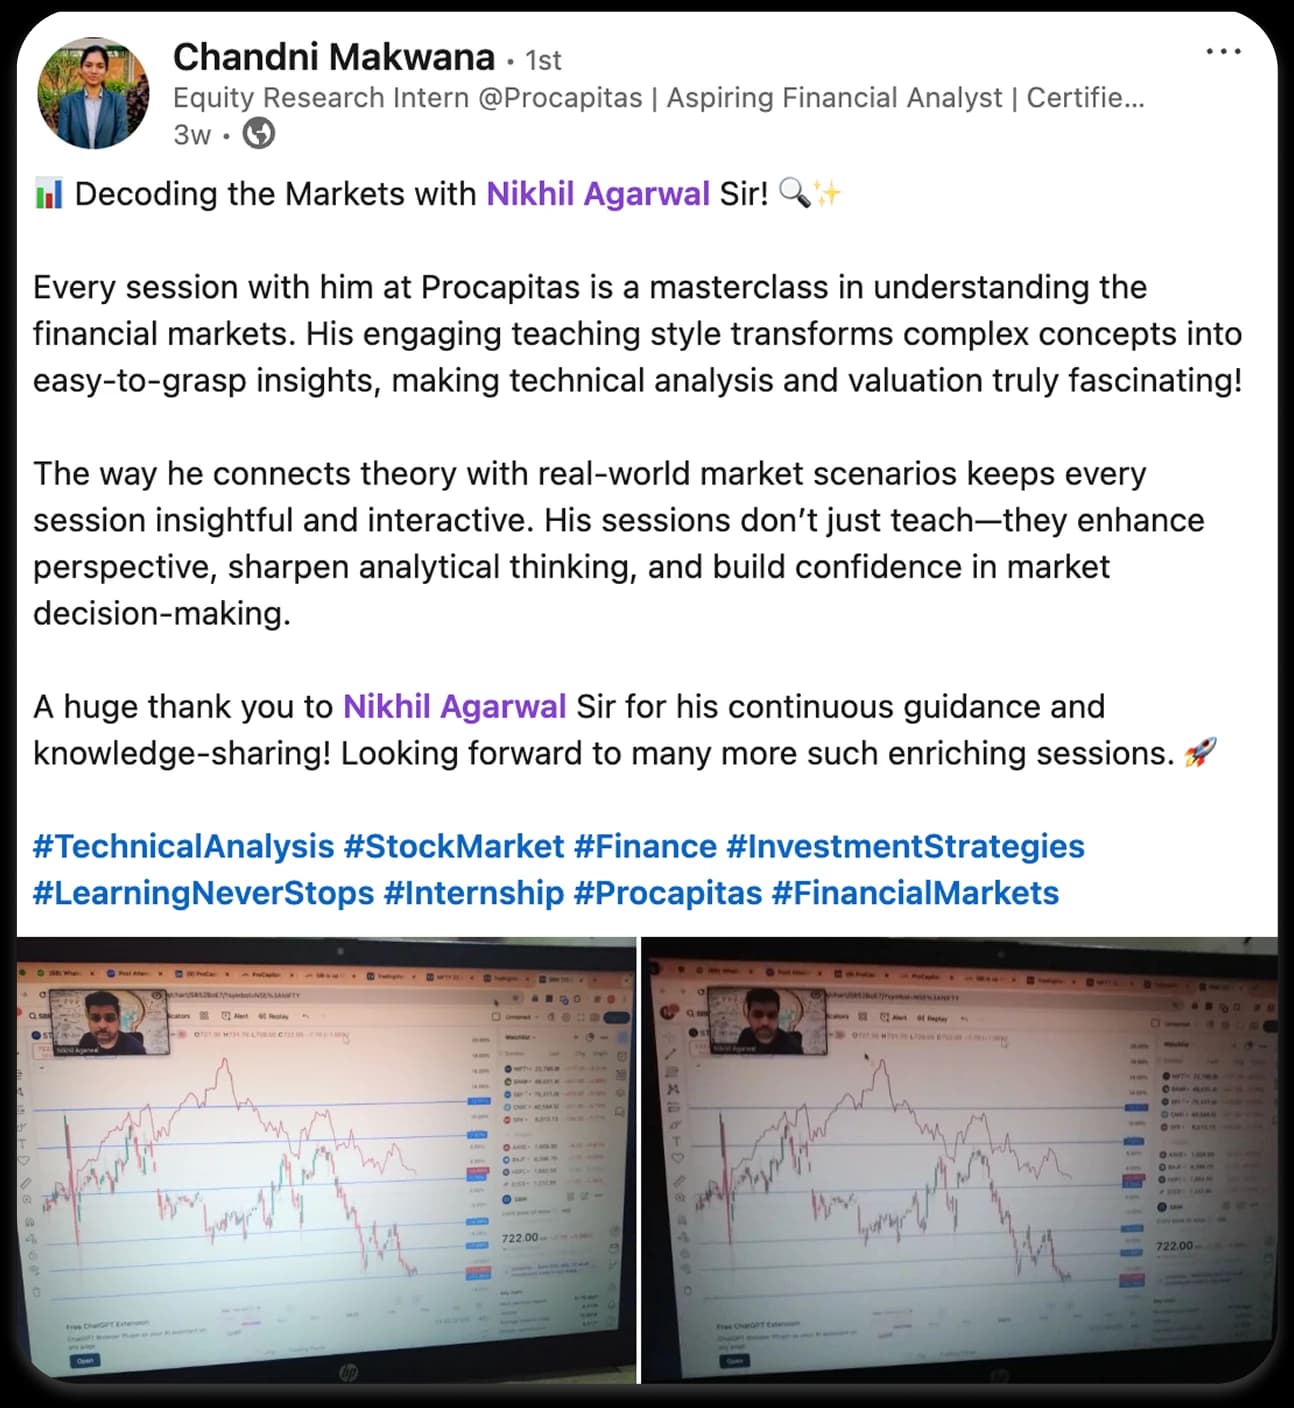
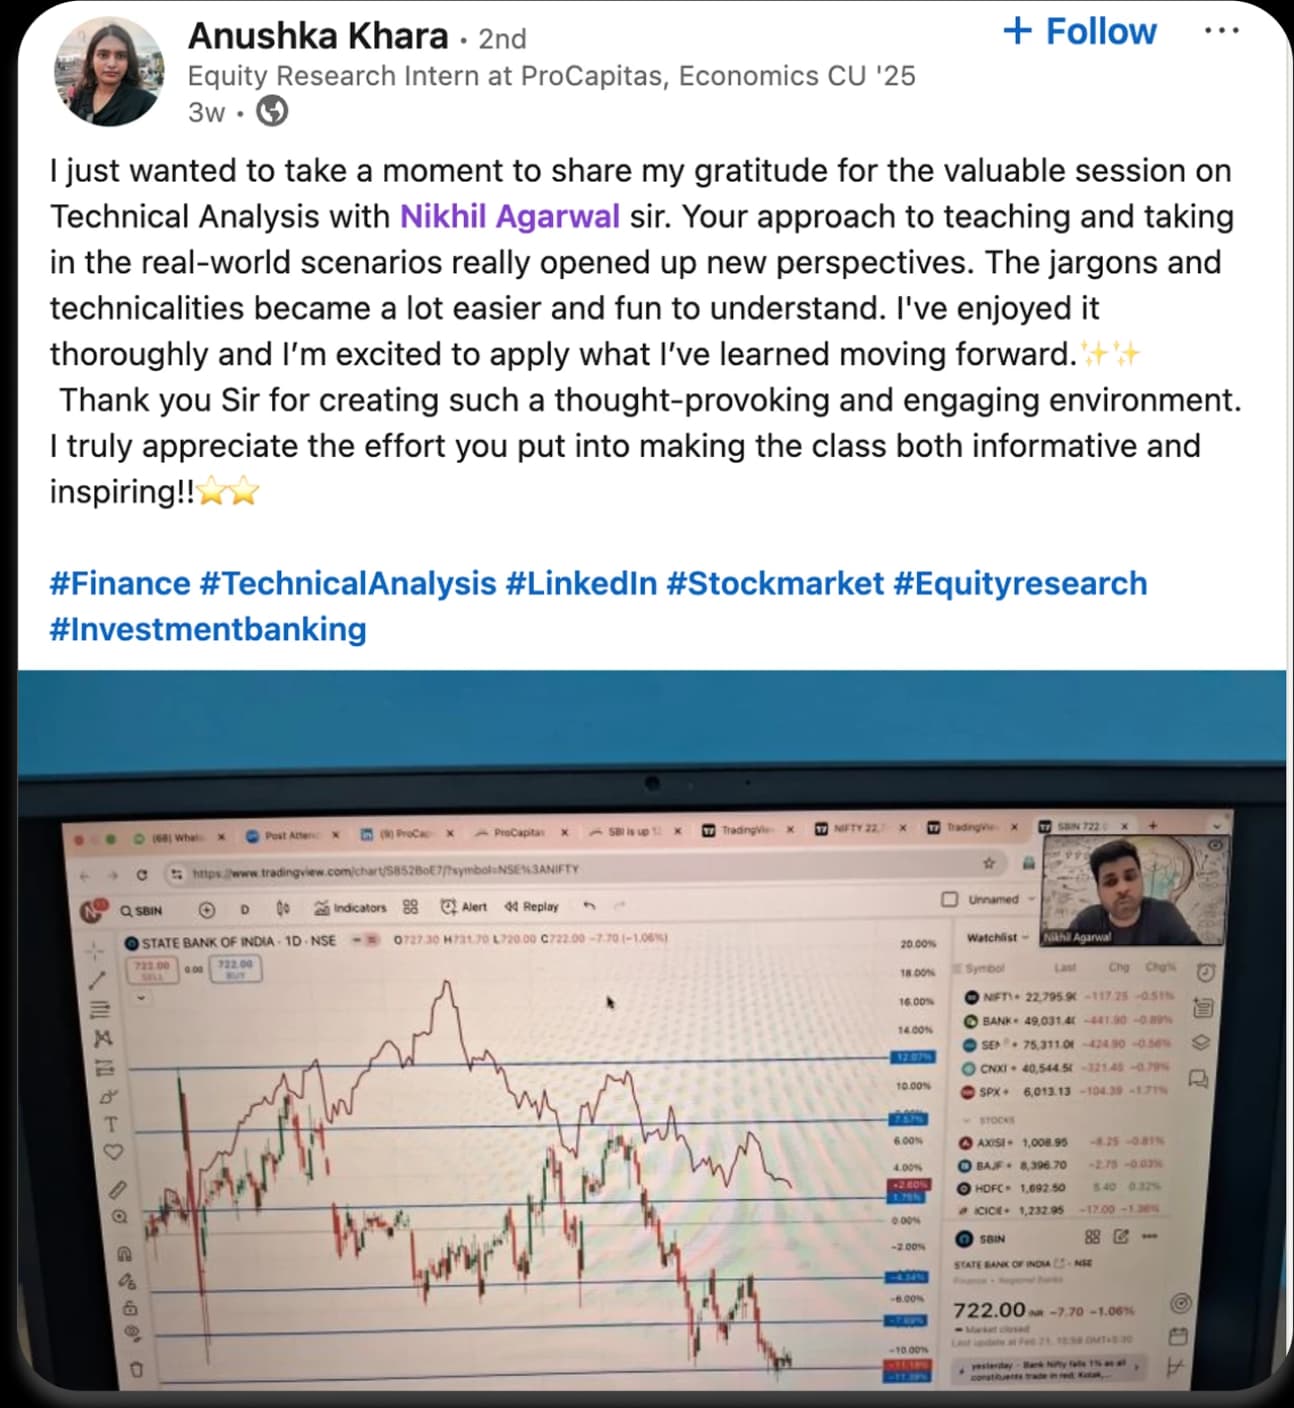
Learn from Nikhil Agarwal and his team, the minds behind a legacy in financial education, with U.S and Australian exposure and over 5000+ student success stories.
Trusted by 43,465+ Students who Attended Workshop
Join 2 Days Free Workshop On Investment Banking And Equity Research
Learn Industrial Case Studies By Also Leveraging A.I.

At Finsckool, students don’t just learn traditional finance concepts. They get hands-on training on Investilo AI, an AI-powered equity research platform built for finance workflows, stock research, analytics, reports, dashboards, and investment banking use cases.
From company research to AI-driven reports, valuation insights, market summaries, and analyst-style dashboards, students learn how modern finance professionals use AI to work faster, think sharper, and produce industry-ready outputs


Use AI to research companies, analyze markets, generate insights, and understand business fundamentals faster.
Learn how to create complete stock research reports in minutes with structured summaries, cited insights, and analyst-style outputs.
Get hands-on exposure to dashboards, analytics, technical analysis, market data, and research workflows built for finance teams.
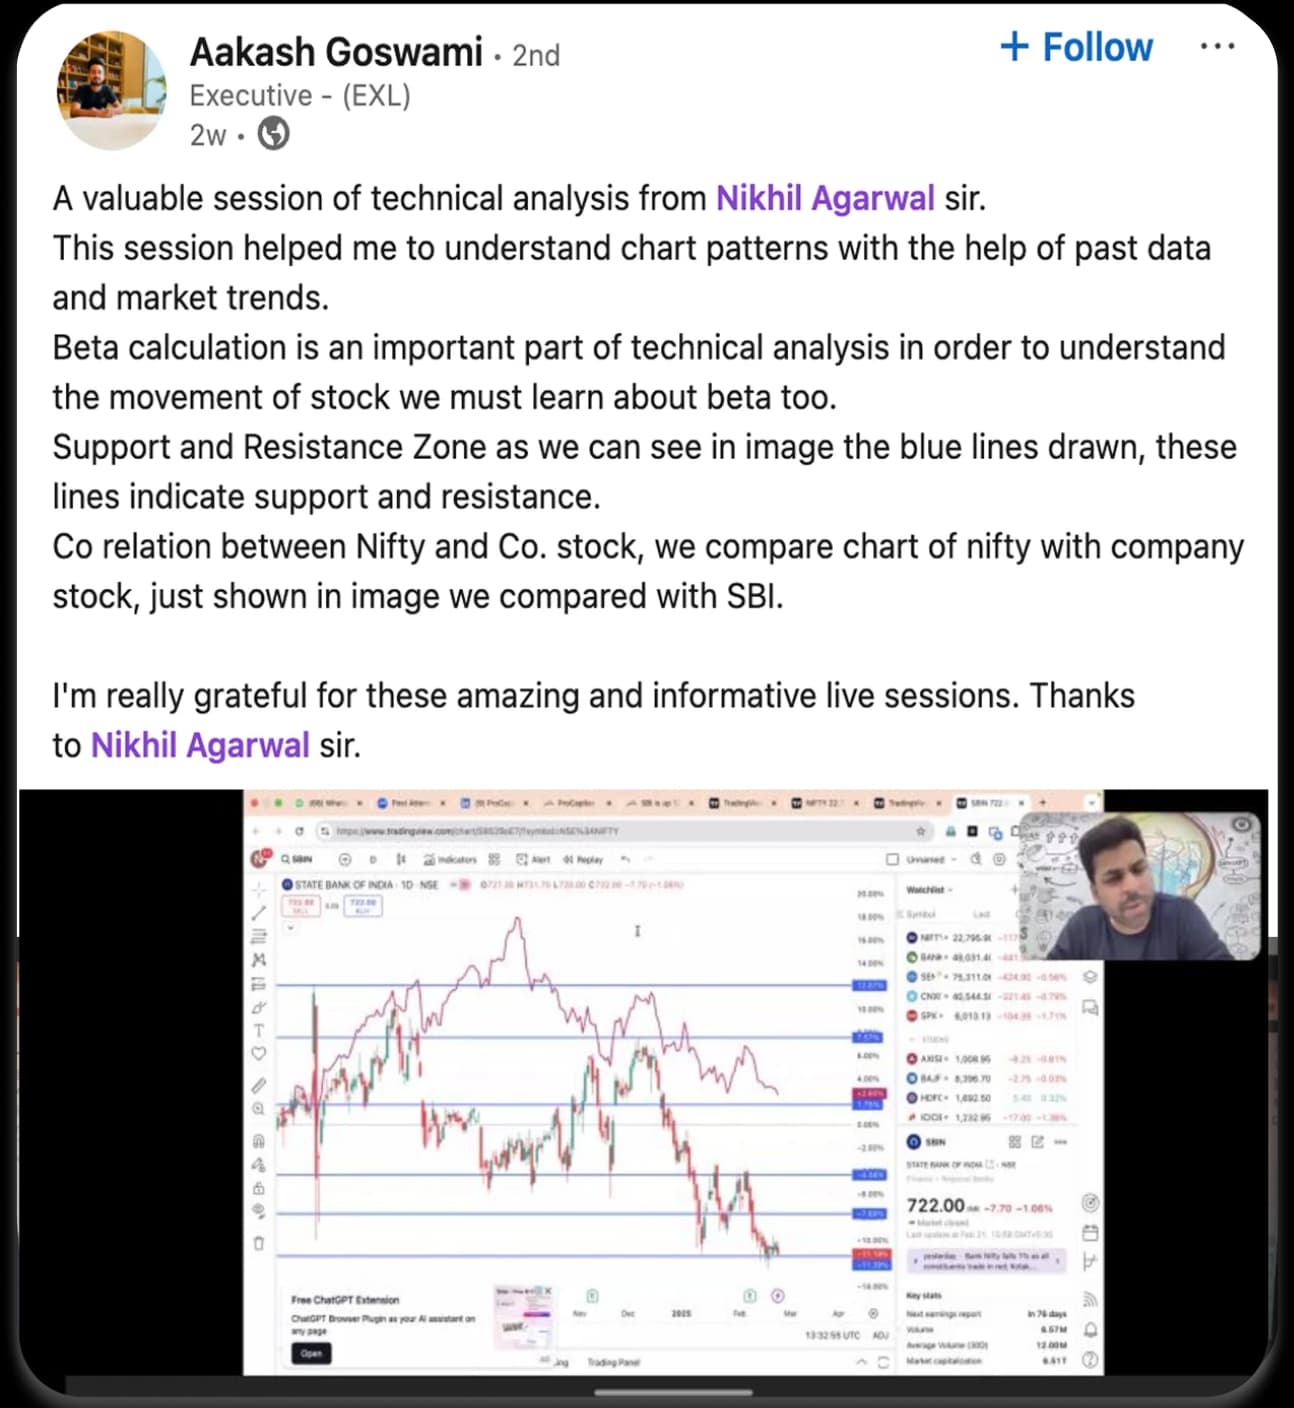
Access practical video lessons on balance sheet forecasting, cash flow modelling, assumption sheets, support & resistance, and price action — designed to help finance students build real analyst-level skills.
Built for future Investment Bankers and Equity Research professionals. Our research reports are crafted using real-world valuation frameworks, global market analysis, and AI-integrated financial modeling - preparing students for industry-ready finance careers.
Success Stories
Next Big Placement Reveal Coming Soon 🚀
Big Placement Update for 2026 | Equity Research Analyst
🔥 11.11 LPA Placement at Anand Rathi | Finsckool Placement Podcast — NOW LIVE!
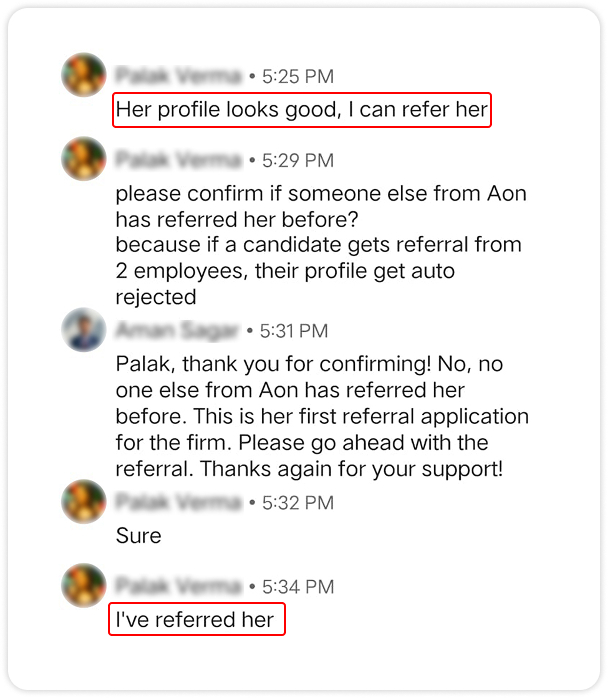
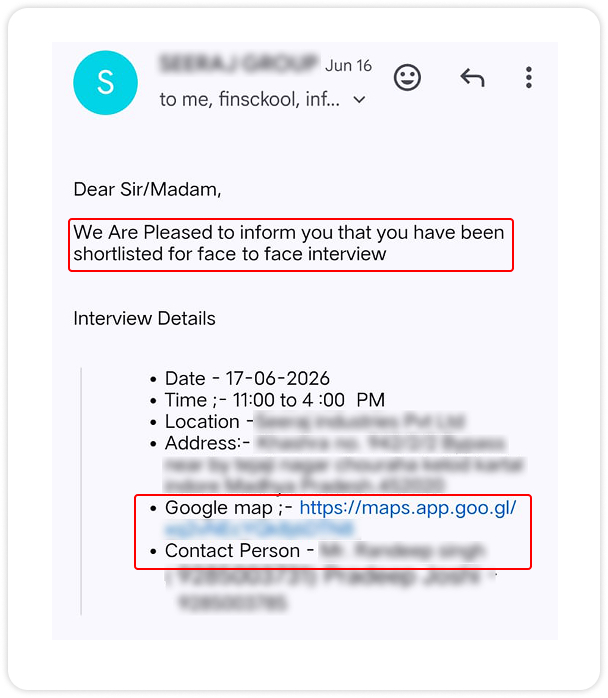
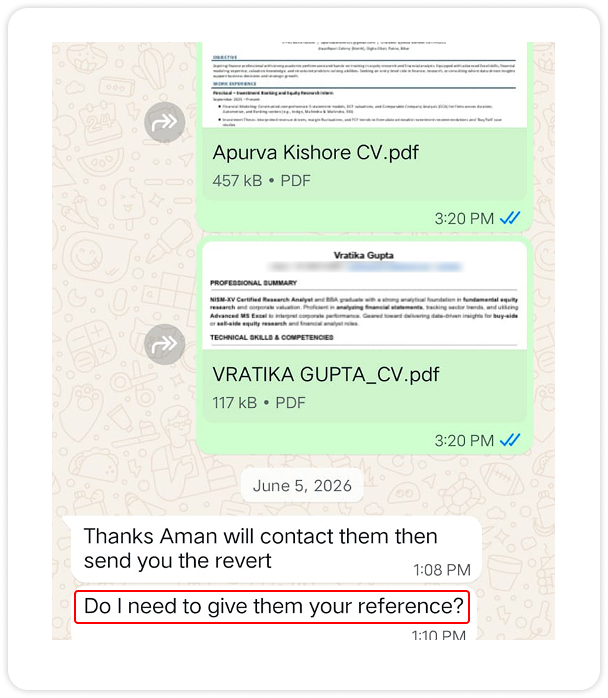
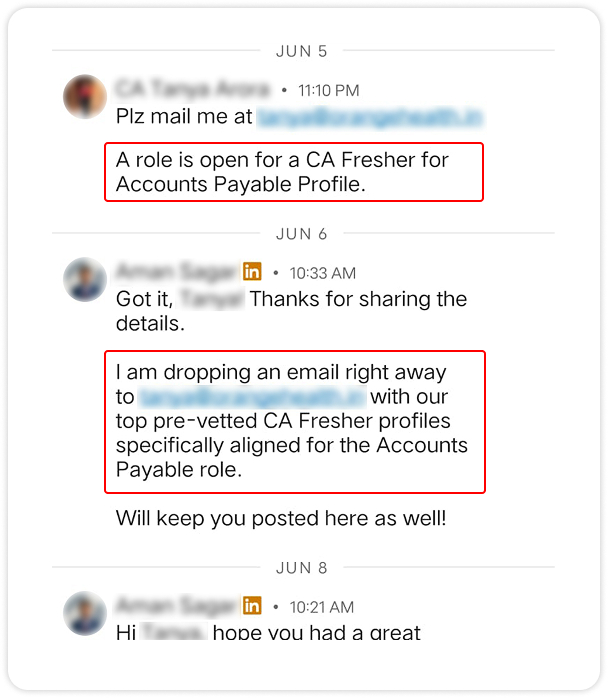
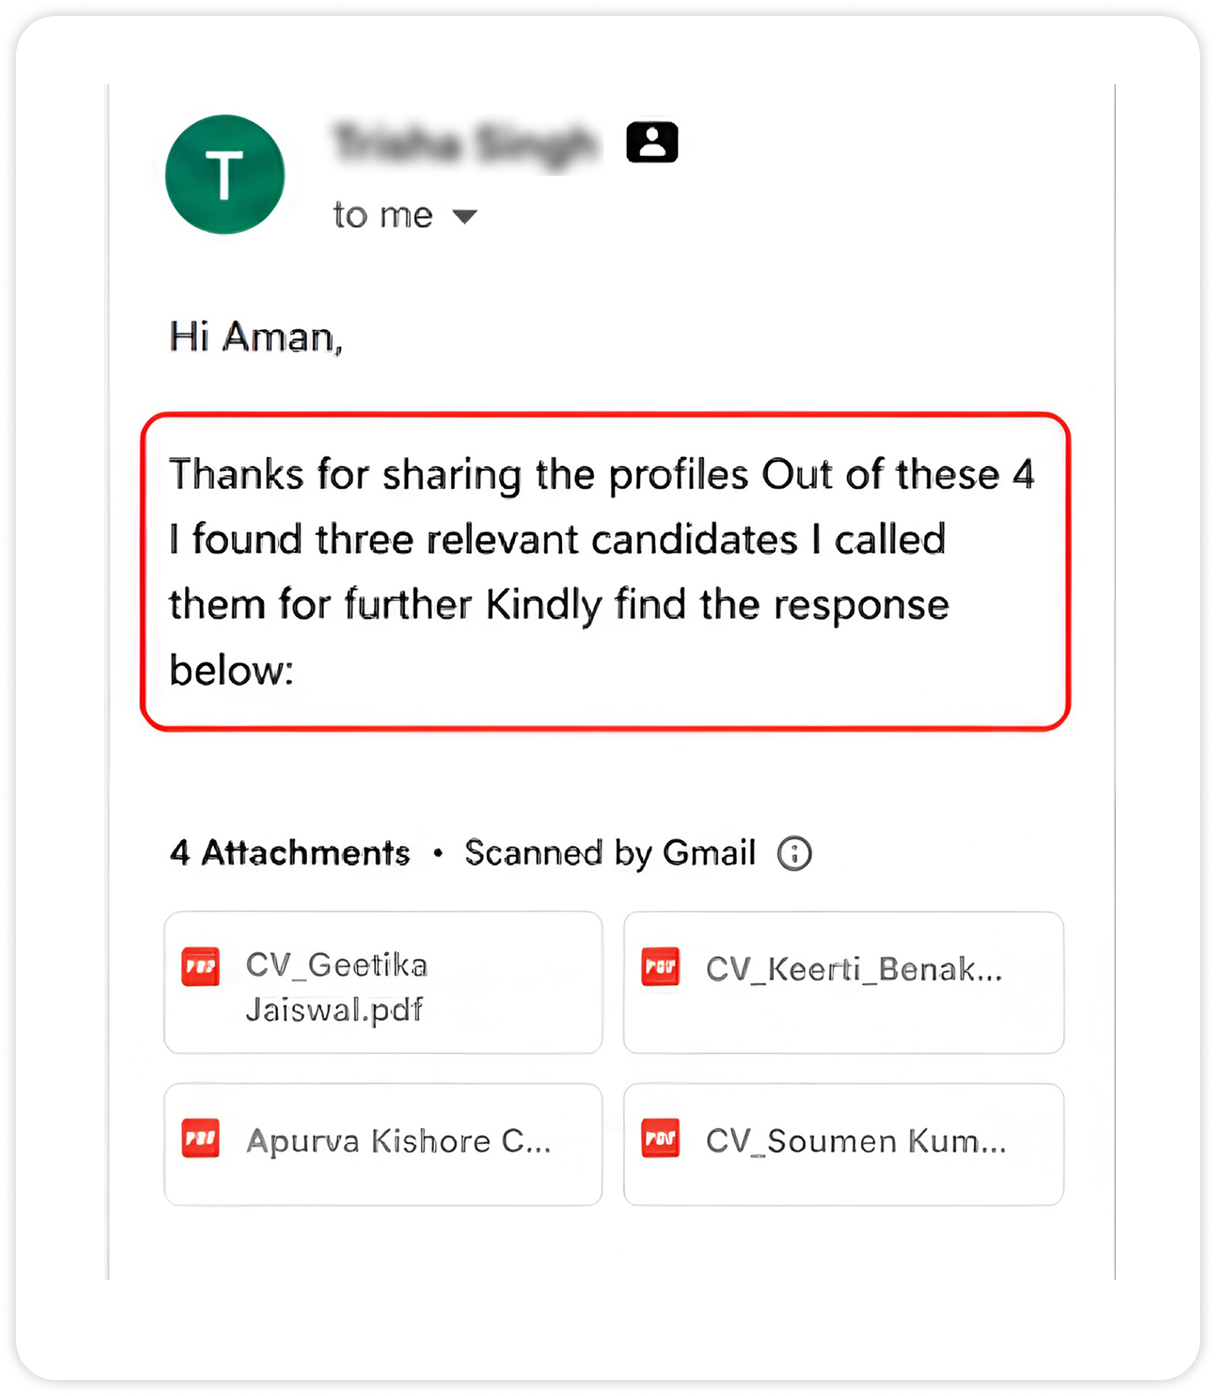
At FinSckool, we help students go beyond classroom learning by connecting them with real recruiters, sharing their profiles for relevant finance opportunities, and supporting them through referrals, shortlisting, interview coordination, and hiring follow-ups to move them closer to their dream finance career.
Watch Our
Watch real stories, finance insights, and AI-powered learning from Finsckool.
Discover the transformative journey of our students through their testimonials. These stories speak to the impact our courses have had on their professional and personal lives.

Apply Now
Work on live US & Australian valuation projects, build real financial models, and prepare for high-paying finance roles with structured placement support.

